
The Audiogram: your guide to reading it
How Do Audiograms Work?
Audiograms are completely painless, relatively quick tests that determine your level of hearing. They work by recording your responses to certain sounds and pitches, and judging your hearing based on these results. During an audiogram, you will be sat down and given a pair of stereo headphones. These go over your ears, and a series of short sounds will be played at various volumes and pitches. These sounds will be played in your left ear, right ear, and both ears. Your audiologist will also test your ability to hear certain words and phrases along with these static tones. Then, your results are recorded on a graph. This graph is the audiogram. Both your left and right ear will be recorded separately, and their results can vary wildly or match up with one another. This graph will show how well you hear at certain volumes and frequencies.
What Do the Lines Mean?
On your audiogram, you will see two axes. One axis (horizontal) represents frequency/pitch, while the other (vertical) represents decibel volume, or loudness, with louder sounds lower down and quieter sounds higher up. When you look at your audiogram curve, anything below it is audible to you while everything above it is not audible. If you have no hearing loss at all, the audiogram curve runs exactly along the horizontal axis. Hearing tests usually examine people’s hearing from 250 Hertz to 8,000 Hertz, which covers all human speech and more. Vowel sounds fall within the lower range of hearing, while consonants fall within the high range. This is why most people with hearing loss struggle to hear consonants and children’s or women’s voices: they are higher frequency sounds, and you usually lose your high-frequency hearing first.
The lines on your audiogram record each ear’s hearing ability. You will find two on your audiogram, one for the right ear and one for the left. If these lines are parallel and match up, this means you have symmetrical hearing. Your ears have similar hearing abilities and there’s little to no discrepancy between them. However, many people have asymmetrical hearing, which means their ears have different hearing abilities entirely.
The line will likely fluctuate on the graph. This just means you have different levels of hearing depending on the frequency or pitch of what you’re hearing. Most people hear low- frequency sounds better than high-frequency ones, and this intensifies as you age. However, low-frequency hearing loss does exist, and your audiogram will help determine what frequencies you hear best
How Bad Is My Hearing Loss?
Your hearing loss will likely range from mild, moderate, severe, to profound. Your graph will show what decibel volumes you can hear at, and what your decibel threshold is. This is the quietest sound you can hear naturally.
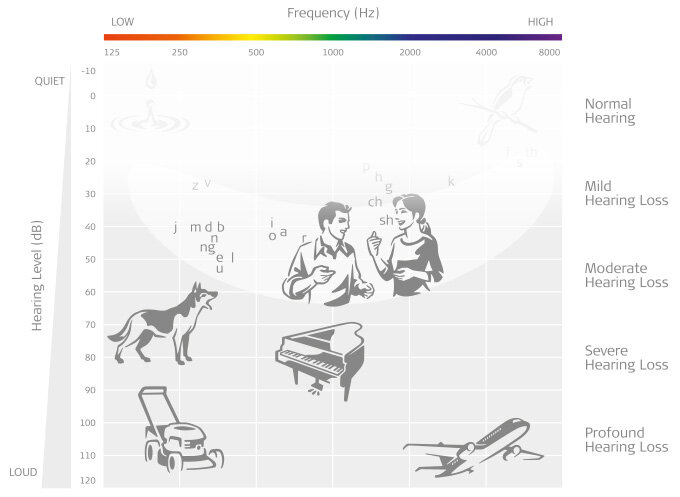
Mild hearing loss means the quietest sounds you can hear are at 25-40 decibels. You might struggle to hear a ticking clock.
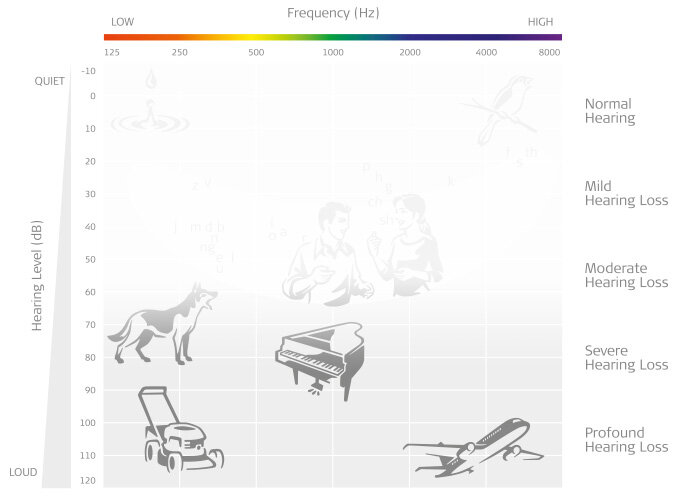
Moderate hearing loss means the quietest sounds you can hear are at 40-75 decibels. You might struggle to understand speech and hear telephones ringing.
Severe hearing loss means the quietest sounds you can hear are at 75-90 decibels. You cannot hear speech without a hearing aid.
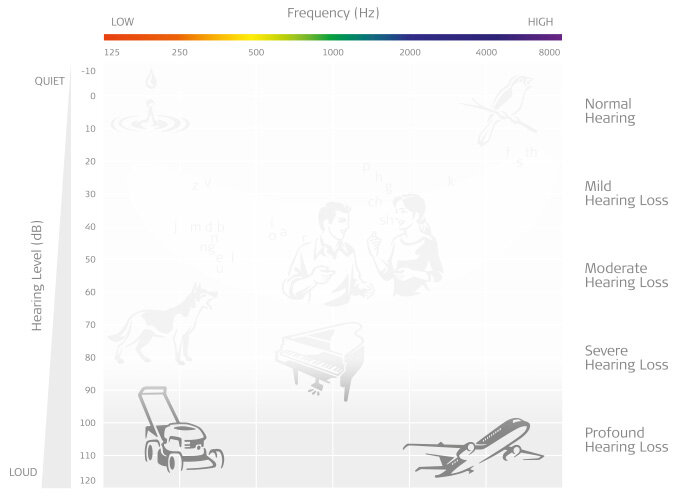
Profound hearing loss means the quietest sounds you can hear are at 90-120 decibels, if you can hear at all. Hearing aids can be ineffective at this level
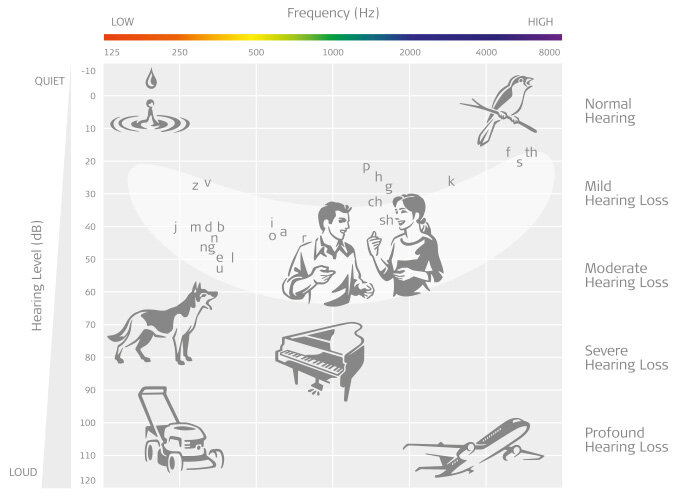
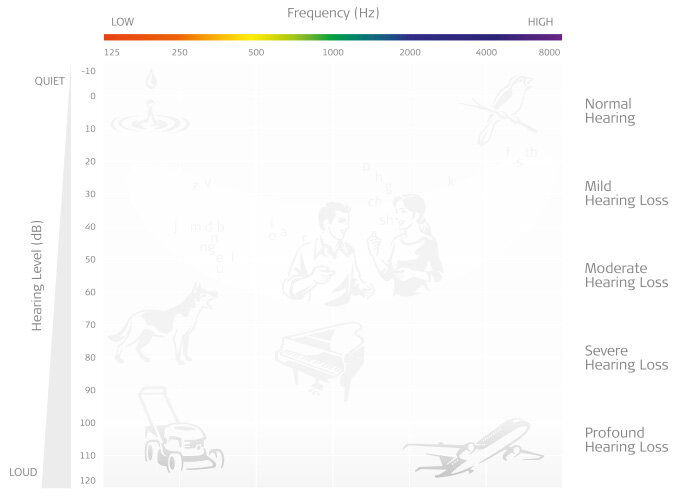
This audiogram also shows the typical pitches and loudness of every-day sounds, and of speech sounds as well. Normal hearing individuals have hearing thresholds between -10 to 20dB across all frequencies. Anything above this is classified as a hearing loss of different severities – from mild to profound. Looking at the image, it is easy to see why someone with even a mild hearing loss may struggle – there are many sounds they can miss out on and not hear clearly.
Source: